Future Cement · the performance measure for cement plants
Some plants replace more than half of their coal with waste. Why not yours?
In Germany, kilns replace more than 60 % of their fossil fuel. Most kilns in the Gulf are only starting. See what each ton of waste fuel really gives your plant, and the safe path to a higher rate.
Every morning: what yesterday cost, and the first thing to fix.
A few daily readings become cost per ton, energy and CO₂, set against the best plants of the same type. Watch one figure move and see what it does to the others: that link is what each dashboard measures for your plant, every day.
Kiln Performancetrial plant · day by day
Heat 19 kcal/kg above target: +$1,457 of fuel a day
HEAT744kcal/kg
FUEL COST12.85$ per t
ABOVE TARGET1,457$ a day
KILN RUNNING96.8% of the day
Kiln Performance
Is your kiln as good as the best kilns of its type?
160+figures worked out for you, every day
Where each kilocalorie went. How much false air comes in. How well the cooler gives the heat back. What the fans cost. And the kiln condition, with the first thing to check.
Heat balanceGas and airBurning zoneCoolerFans and powerEmissionsCost per ton
Alternative Fuel Performancetrial plant · day by day
At 12 % moisture the waste fuel earns +$5,329 a day
MOISTURE12%
HEAT VALUE4,504kcal/kg
ASH13.5%
NET RESULT5,329$ a day
Alternative Fuel Performance
How far is your kiln from 50 % waste fuel?
100+figures worked out for you, every day
What each ton of waste fuel really gives you: the coal it saved and the gate fee, minus the heat and the clinker the kiln lost for it. And the next safe step to a higher rate.
Substitution rateNet value per tonExtra heatClinker lostChlorine riskStore safety
Clinker factor 78 %: 674 kg CO₂ in each ton of cement
CLINKER FACTOR78%
CO₂674kg per t cement
POWER92kWh/t
CARBON COST343,730$ a day
CO₂ Performance
Know your CO₂ per ton before your buyers ask.
100+figures worked out for you, every day
CO₂ per ton of clinker and of cement, rated on the GCCA scale. Where it comes from, and the steps that bring it down, each with what it is worth to the plant.
Per ton clinkerPer ton cementClinker factorFuel and powerGCCA ratingSteps ranked
Same Blaine, 28.8 kWh/t: EBITDA −$918 a day against the best mill
POWER28.8kWh per t
POWER COST2.45$ per t
EBITDA VS BEST-918$ a day
BLAINE3,564cm²/g · held
Cement Mill Performance
How many kWh does each ton of your cement cost?
50+figures worked out for you, every day
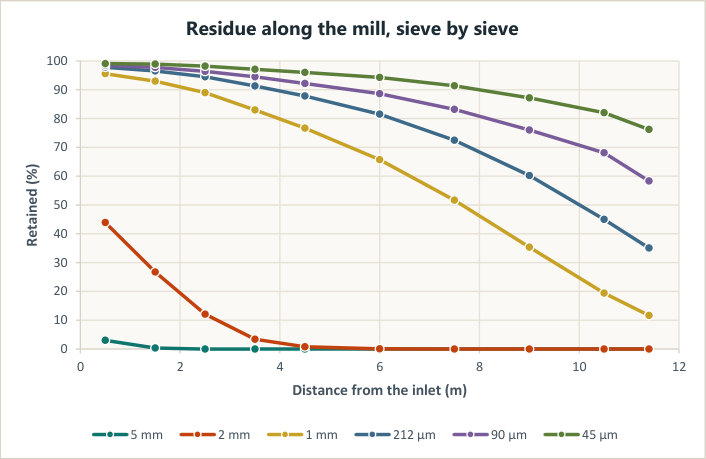
The best vertical mills grind PPC with 18.8 kWh a ton, the best ball mills with 27. See every one of your mills against the best mills of the same system grinding the same cement, and what is holding it back.
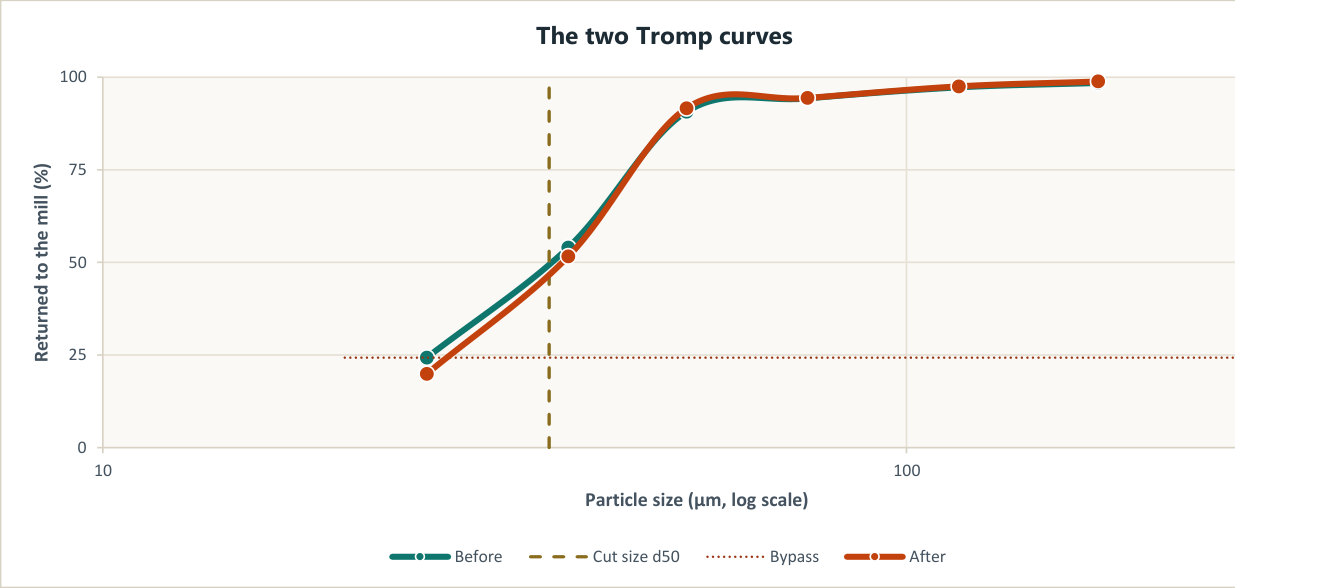
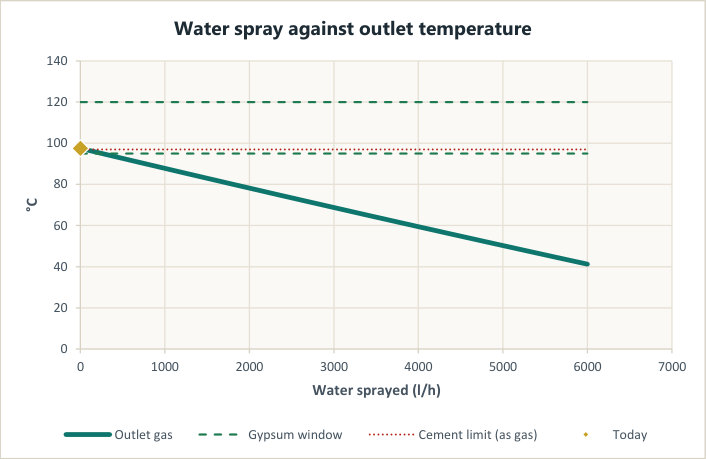
kWh per tonOutput at the same BlaineParticle size spreadBall charge fillingCirculating loadOutlet temperature
51.5 MPa at 28 days: room for a 78 % clinker factor
C₃S54.0%
28 DAYS51.5MPa
CLINKER FACTOR78% possible
MATERIAL COST36.86$ per t
Cement Quality
Does every cement you ship meet its class?
70+figures worked out for you, every day
The clinker of the day worked out into LSF, moduli and minerals, and every cement judged against the limits of the standard it is sold under: strength, setting, SO₃, loss on ignition, chloride.
LSF and moduliBogue mineralsStrength against classSetting timesSO₃ and LOIStrength per Blaine
Both ways give the same dashboard and the same report. Writing the day is free; sending the plant's own data comes with the book of the dashboard. Start with one day: it gets better with every day you add.
⏱
How is your kiln today?
Write the readings of the day from the control room and watch the answer appear while you write. About two minutes. No file needed. Try it right here:
Write the three numbers. Your kiln's heat use appears here at once.
Write the tons and the kWh. The power of each ton appears here, against the best mills of the same kind.
Write the strength and the Blaine. How much room your cement has above its class appears here.
Write the four numbers. The share of your kiln's heat that comes from waste appears here.
Write the clinker share and the heat. The CO₂ in each ton of your cement appears here.
Questions from real plant situations, with the reason behind every answer, and a full timed CEM exam (Certified Energy Manager) among 257 CEM questions. Each book opens the questions of its topic.
700+ questions written from plant situations. No account needed to try this one.
Try one nowPreheater and Calciner Systems
Fuel consumption has risen by 35 kcal/kg in one month. Oxygen at the preheater exhaust reads 7.5 %. Oxygen at the kiln inlet is steady at 1.8 %. A junior supervisor wants to open the ID fan damper further.
What is causing the oxygen gap, and why is opening the ID fan the wrong answer?
In a well sealed preheater, oxygen rises by only 1.0 to 1.5 % between the kiln inlet and the exhaust. A rise from 1.8 % to 7.5 % means severe false air. That cold air is heated by the exhaust gas instead of the raw meal. That is where the 35 kcal/kg went. Opening the ID fan raises the negative pressure and pulls in more cold air, so the loss gets bigger.
A European engineering team, headquartered in Oviedo, Spain, with a partner office in Aachen, Germany.
Process, pyroprocessing, alternative fuels, cement chemistry, energy and materials handling. More than 140
production lines audited between them. Meet the team →
Where do the formulas come from?
Bond, DIN 66145, ASHRAE, the GHG Protocol and IPCC, and published plant engineering.
Every grade on a dashboard names the reference it is read against.
Where is plant data kept?
On Future Cement servers, under the account that entered it. Calculations run on the
server too, so a copied page cannot run them. No other company sees the figures, and
plant names never appear in any comparison.
What if my plant is different?
Every dashboard works from measurements, not from a nameplate or a model. Your charge, your
speed, your geometry.